


Companies are investing in data-driven product management tools to inform everything from project development to customer experience. Business leaders, from CTOs to product managers use analytics software to leverage data and turn it into a competitive advantage.
Such software has evolved rapidly over the past few years. Traditional business intelligence focused on static reports and dashboards showed what happened. Now we are in the era of predictive and prescriptive analytics, even AI-driven analytics. Modern cloud-based platforms use AI, ML, and natural language to create augmented analytics. This means systems visualize data, interpret it, predict future trends, and suggest optimal strategies.
Let’s explore the latest trends in analytics software and how it enables instant insights, how embedded analytics shapes everyday workflows, and how predictive and prescriptive analytics are impacting product management and strategic decision-making.
Key tech trends and their impact
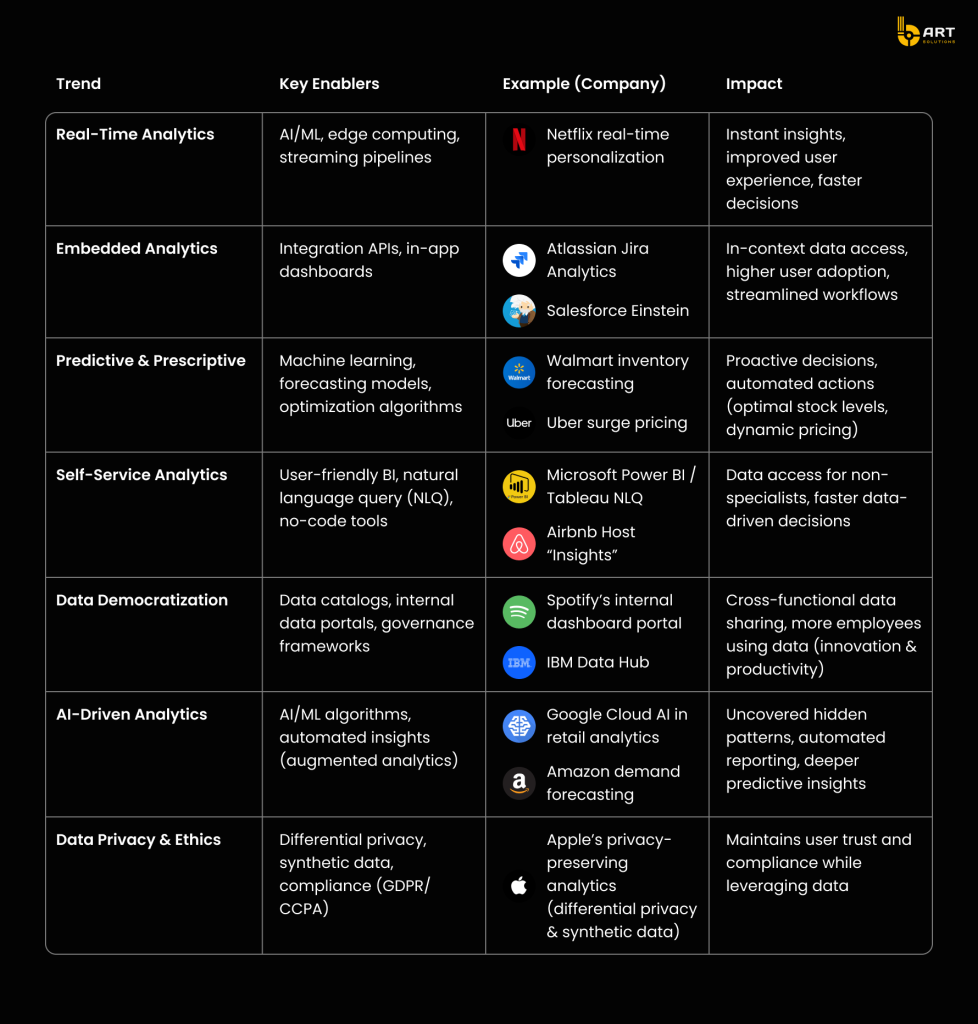
Real-time analytics
Real-time analytics allows companies to respond immediately to market changes. Advances in streaming frameworks (Kafka, Apache Flink) and AI-driven automation help businesses to process millions of events per second, and edge computing speeds it up even more by processing data closer to where it’s generated (IoT devices, user phones, etc.).
Gartner states that in 2025, 75% of enterprise data will be generated and processed outside traditional centralized data centers.
Netflix is a good example of this approach. The platform streams huge volumes of events (views, clicks, searches) into a real-time analytics tools that instantly personalizes and updates content recommendations for users. So when a user finishes watching a show, Netflix immediately adjusts the “Recommended for You” section. Data is a product, and real-time analytics ensures each user’s experience adapts to their behavior in the moment .
Real-time reporting software coupled with AI-driven analytics provides a live pulse on the business. Operational dashboards monitor system health, customer transactions, and key metrics in real time, enabling rapid response.
Embedded analytics
As data becomes essential for every workflow, there is a strong trend toward embedded analytics solutions that bring charts, reports, and AI insights into the existing tools instead of requiring a separate BI application. It can be as simple as an interactive dashboard inside a project management app, or advanced AI-driven recommendations in a CRM system.
Atlassian introduced Atlassian Analytics, which embeds powerful reporting and visualization directly into Jira Software, Jira Service Management, and Confluence . Teams can view project KPIs, workflow bottlenecks, or time-tracking reports within Jira’s interface. Atlassian uses a low-code/no-code interface so even non-technical users can build custom charts from their projects.
Another example is Salesforce Einstein Analytics (now part of Salesforce CRM offerings). Salesforce has embedded an AI-powered analytics layer into its Customer 360 platform, so that sales, marketing, and service teams get AI-driven insights. Einstein analyzes CRM data to deliver predictions (like which leads are most likely to convert) and recommendations (like next-best actions for customer service). By embedding AI directly into the workflow, Salesforce made advanced analytics solutions accessible to front-line business users.
Many enterprise software products now offer built-in analytics modules or the ability to plug in third-party analytics components (for example, embedding a Tableau or Power BI dashboard into another application). Analytics tools for product leads also increasingly include embedding capabilities – product managers can incorporate analytics dashboards into their SaaS products to add value for their customers (e.g., a software product that shows its users reports on their usage or ROI).
By 2032, the embedded analytics market is expected to reach $74.98 billion, and any data will be at the fingertips.
Predictive and prescriptive analytics
Predictive and prescriptive analytics are irreplaceable for automated decision-making.
Predictive analytics uses statistical models and machine learning on historical data to forecast future outcomes: for example, predicting customer churn, future sales, or equipment failures.
Prescriptive analytics goes a step further by suggesting and even automatically executing) the best course of action based on those predictions . This allows to shift from reactive business strategy to proactive with autonomous decision-making.
Advances in algorithms and the accessibility of machine learning in analytics software have made predictive modeling more widespread.
Walmart uses AI-driven predictive analytics to manage inventory across thousands of stores. By analyzing factors like sales trends, seasonal weather patterns, and local events, Walmart’s system can accurately predict product demand and optimize stock levels. This led to a 30% reduction in stockouts and 20% decrease in excess inventory.
Here is how it works. The AI system considers local weather (e.g. a cold front -> higher soup sales), social events (big game in town -> more snack purchases), and myriad other data. It predicts demand at each store and prescribes how to redistribute products through a logistics network . This led to fewer empty shelves and less overstock – translating to higher sales and lower costs.
Uber’s surge pricing model is another well-known example of predictive and prescriptive analytics working together. The platform continuously analyzes real-time demand (ride requests) and supply (drivers available) in each area. Using machine learning algorithms, it predicts high-demand periods/locations and then prescriptively adjusts prices upward in those areas. Dynamic pricing ensures rides are available when needed by motivating drivers to reposition or go online.
Predictive analytics for product management helps teams anticipate user behavior and optimize roadmaps.Predictive models can also forecast how a new feature might increase engagement or which user segments will most likely adopt a feature. This helps to prioritize development and allocate resources to ensure the highest ROI.
The rise of predictive and prescriptive reporting software means that dashboards now often include indicators like forecasted trend line and suggested actions.
According to a McKinsey report, companies that extensively use AI-driven predictive analytics can reduce forecasting errors by 20–50%, leading to 20–30% inventory reductions on average.
Self-service analytics
Self-service analytics is a game-changing trend that democratizes data access. The goal is to offer self-service analytics platforms that are easy enough for anyone to use, while still robust enough to handle complex requests. These platforms feature intuitive drag-and-drop interfaces, natural language querying that uses plain English, and rich data visualization capabilities.
Gartner predicts that by 2026, 75% of businesses will have adopted self-service analytics.
Self-service analytics tools include popular platforms like Tableau, Power BI, Qlik Sense, and cloud-based offerings like Looker and ThoughtSpot. These tools are increasingly incorporating AI-driven features to help users generate insights. For example, both Microsoft Power BI and Tableau have introduced natural language query features.
Augmented analytics features like automated insight detection (where the software highlights an unusual spike or trend it found in the data) further guide users even further.
Airbnb
Airbnb provides its hosts with an “Insights” self-service analytics dashboard as part of their hosting platform. Hosts can easily see metrics about their property’s performance: views, booking conversion rate, average nightly rate compared to the market, occupancy trends over time, and so on. They can filter and compare across time frames or against local benchmarks. Airbnb’s Insights essentially puts data-driven decision-making tools in the hands of hosts so they can optimize their listings. For example, if a host sees that bookings are low compared to similar listings, they might adjust their price or improve their listing photos.
Microsoft Power BI enables users to connect to various data sources and create reports via a drag-and-drop interface. One standout feature is Power BI’s Q&A, where users can type questions in natural language.
The result of self-service is a more data-driven culture: product managers, marketing leads, and finance analysts can independently explore data and get insights when they need them, leading to faster and more informed decisions. It aligns with the concept of the “augmented consumer”, where the end-user of analytics is empowered by AI and automation to explore data on their own . Of course, leading platforms include data security and governance features to ensure users only access what they should, and that there’s a “single source of truth” for metrics even in a self-service environment.
Self-service analytics also ties closely into the next trend, data democratization.
Gartner notices that self-service analytics market is projected to reach $12 billion+ by 2026.
Data democratization
Data democratization is about making data accessible to anyone and enabling cross-functional sharing of insights.
Several companies have made data a core part of their data strategy.
Spotify is a great example of a data-driven culture. They created a “Data Insights Guild” and invested in tools and workflows to ensure any employee can find and use data. They also built an internal Dashboard Portal, a searchable catalog of all approved dashboards across the company . For instance, a product manager can find a dashboard on user engagement metrics.
Spotify also implemented a Dashboard Quality Framework to maintain trust in the data. Every dashboard gets rated based on completeness and best practices . By providing this one-stop portal and ensuring quality, Spotify eliminated the need to ask around for data; any team member can self-serve the insights they need. This is supported by strong data literacy efforts (training people to interpret data correctly).
As Spotify’s R&D chief put it, “Our competitive advantage isn’t just having data – it’s having thousands of people who know how to use it.”
Another example is IBM, which launched an internal Data Product Hub, an internal data marketplace that supports data sharing. The platform allows data producers to package datasets as “products” with proper documentation and governance, and publish them to the hub. Data consumers can then discover and request access to these datasets via the marketplace. By treating data as a product and managing it in a centralized hub, IBM aims to simplify finding and accessing information, while maintaining security and compliance centrally.
The barriers between departments disappear when data is a shared resource. Businesses that go for data democratization see a significant increase in customer satisfaction because support and marketing, and product can all access the full picture .
Data democratization does not mean free-for-all access to sensitive data. It means controlled, well-governed access using role-based permissions, data masking for sensitive fields, audit trails, etc. Actually, proper democratization can even enhance security.
Companies with strong governance around democratized data saw 41% fewer data breaches compared to those with rigid silos but weak oversight.
AI-driven analytics
AI-driven analytics is the most transformative trend in modern software. This includes leveraging ML and even generative AI to enhance data analysis: from automating data preparation to detecting patterns and explaining insights in natural language. The goal is to make analytics smarter and more automated.
Key capabilities of AI-driven analytics software include:
- Automated insight discovery: The system can continuously analyze data and surface remarkable findings. It uses ML to find anomalies, spikes, correlations, and segments of interest.
- Natural language generation (NLG): The software can generate written or spoken narrative summaries of charts.
- Predictive and prescriptive analytics: AI/ML models are built-in to provide forecasts and recommendations.
- Conversational analytics: Users can interact with the system via voice or chat, asking complex questions and follow-ups, with the AI handling context and analytical logic.
- Cognitive/AI-enabled data prep: The systems suggest how to join datasets, cleanse anomalies, or enrich data, reducing the manual effort before analysis.
All major BI and analytics platform vendors are adding AI features. For example, Microsoft’s Power BI has an AI visual that uses ML to show factors influencing a given metric. Google Cloud offers tools with AI-driven features to integrate predictive results into dashboards.
Industry applications of AI-driven analytics
- In healthcare, AI-driven analytics are used to comb through patient data and medical records to identify risk patterns. These predictive insights can be embedded into clinicians’ dashboards, prioritizing which patients need follow-up. During the COVID-19 pandemic, many healthcare systems used predictive models to manage ICU capacity and prescriptive analytics to allocate resources.
- In retail, AI-driven analytics software helps with everything from personalized recommendations, like Amazon’s famous recommendation engine, to optimizing supply chains. In fact, Amazon is reported to leverage predictive models for demand forecasting and an AI optimization system for its logistics. By doing so, they achieved faster delivery times and a 15% reduction in shipping costs. Retailers are also using AI analytics for customer segmentation. For example, clustering algorithms can be used on purchase data to create customer profiles for targeted marketing.
- In finance, AI-driven analytics detect fraud by spotting unusual patterns among millions of transactions. They also power robo-advisors, which analyze market data and user goals to provide advice.
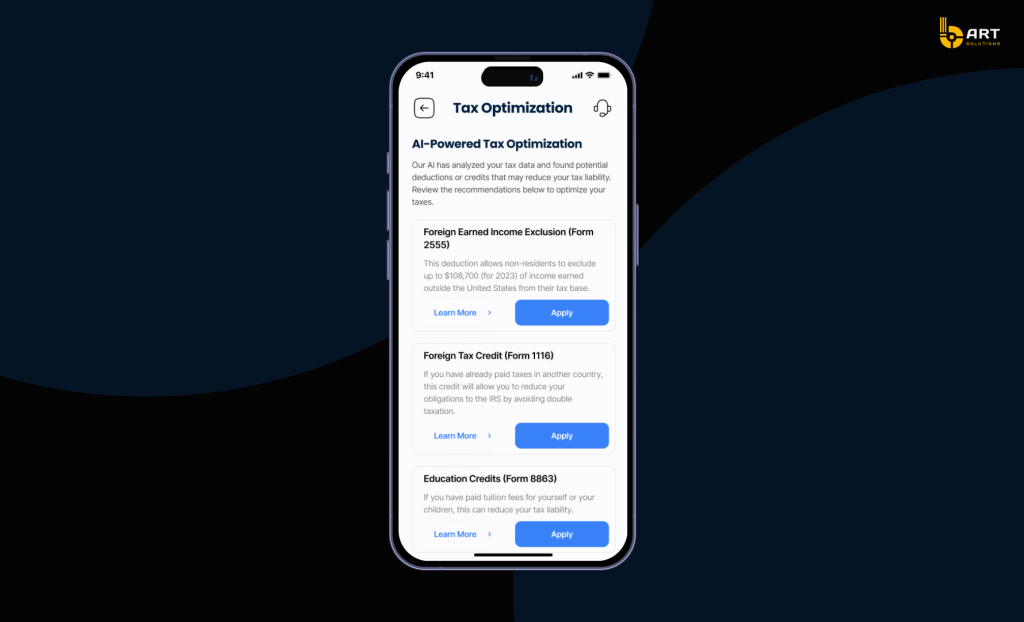
Here is a good example of such software developed by bART Solutions: Tax management platform with advanced AI and cloud integration.
- For product teams and CTOs, AI-driven analytics software provides dashboards that are more like advisors. Instead of a static monthly report, an AI-enhanced report might proactively alerts product leads.
One cutting-edge area is generative AI in analytics, using large LLMs to make analytics even more accessible. There are startups integrating ChatGPT-like capabilities to let executives have a dialog with their company’s data (secured and private).
Human element is still fundamental though. AI-driven insights need validation, and users must be educated to interpret them correctly. When combined with human expertise, AI amplifies the scale and depth of analytics.
The bottom line: AI-driven software is making analytics more proactive, accessible, and insightful. Companies that use AI in business analytics unlock patterns that were previously hidden, driving impact in efficiency, revenue, and innovation.
Data privacy and ethics in analytics
With great power comes great responsibility. As companies collect and analyze more information, they also focus on data privacy and ethics in analytics. Regulations like the EU’s GDPR and California’s CCPA impose heavy penalties for misuse of personal data or breaches.
Best practices in analytics software development
Privacy by design. Analytics software for CTOs and business leaders must have built-in mechanisms to anonymize or minimize personal data usage. One approach gaining traction is differential privacy, a mathematical technique that adds calibrated noise to data or queries, so that aggregate analyses are accurate but individual records cannot be identified.
Apple pioneered the large-scale use of differential privacy in consumer analytics. Devices collect usage data (for features like typing suggestions or new emoji usage) from users who opt in to share data, but they implement differential privacy so that Apple “can gain insights into how products are used while preventing the identification of any individual’s data”. The system might want to know the most commonly typed new slang words to improve the keyboard, but it doesn’t store every user’s keystrokes. So it randomly perturbs the data it collects from each device, a single device’s report is noisy and not very useful on its own, but in aggregate across millions of devices, the true trends emerge statistically. This allows Apple to improve its software based on user behavior without ever seeing personal data tied to any user.
Synthetic data. These are artificially generated datasets that statistically resemble real data but contain no actual personal records. Companies are using synthetic data to train and validate analytics models for sensitive content.
Compliance with privacy laws is also driving changes in reporting software. Many analytics tools offer features to easily anonymize or delete personal data fields.
Governance dashboards might alert if someone is querying data they shouldn’t, like an unusual number of queries on personal identifier fields. There’s also growth in federated analytics, where data can be analyzed in a decentralized way. Instead of pulling all data into one warehouse, queries are sent to where the data resides, and only aggregate results are returned.
Ethical considerations go beyond privacy. Companies are scrutinizing analytics models for bias and fairness. Prescriptive analytics used in HR for screening job candidates must be checked to avoid perpetuating discrimination.
Transparency and explaining to users how their data is used is the key. For example, if a bank uses an AI-driven analytics model to decide creditworthiness, regulations might require providing an explanation for a rejection (which variables contributed), and here explainable AI intersects with analytics.
Cloud analytics platforms use encryption and include the ability to operate in virtual private clouds to isolate data. Some have built-in GDPR compliance reports, making it easier to report data handling practices to regulators.
In April 2025, Apple detailed how they use differential privacy and new techniques like synthetic data generation to maintain this standard.
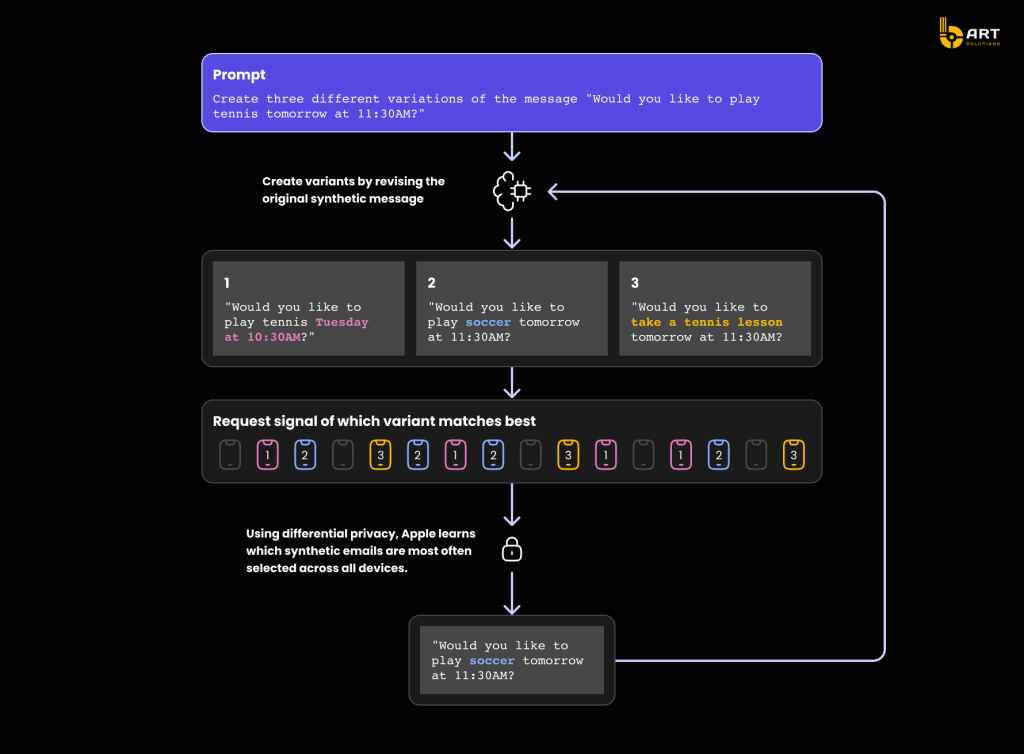
So for the Genmoji feature (an AI image generator using text prompts), Apple collects data on popular prompts people request only through a differentially private mechanism, ensuring unique or rare prompts remain secret and nothing can be tied to a user . By doing so, Apple improves the feature by knowing what types of prompts to optimize for, without ever storing what a specific person requested.
This became a gold standard for the best analytics tools for enterprises that collect and emulate data in 2025.
Conclusion
Analytics and reporting software have come a long way from static retrospective reports to dynamic, AI-powered engines that can drive decisions in real time.
The key trends are embedded analytics, predictive/prescriptive analytics, self-service, data democratization, AI-driven analytics, and privacy-focused analytics. It’s no longer just about knowing what happened, it’s about empowering businesses to make better decisions continuously, with foresight, and with responsibility.
Data-driven strategies are projected to outperform gut-driven strategies in 65% of B2B companies by 2026.
Adopting analytics software for enterprises doesn’t mean ripping out the existing tools, but enhancing the data ecosystem.
As you implement innovative analytics software solutions, measure the impact. Look at how much faster decisions are made, or how product metrics improve due to insights, or how much time is saved by users creating their own reports.
Also, stay tuned, the analytics and BI space is rapidly evolving (with cloud and AI advances, new tools are emerging continuously).
If you have a project in mind, bART Solutions can help you build innovative analytics software implementations tailored to your domain be it fintech, logistics, ecommerce, or SaaS. Drop us a line to future-proof your analytics with certified Microsoft developers.
Why are businesses investing so much in analytics software?
90% of enterprises see data as critical to their operations for optimizing workflows to enhancing customer experience. Modern analytics tools don’t simply show what happened, they predict and prescribe what to do next.