


Not so long ago, dashboards were just windows into data. They showed what happened: latest sales, churn, current inventory. But they didn’t adapt or suggest what to do next.
AI-powered business intelligence solutions are reshaping how businesses plan and act. Power Platform, Azure AI, OpenAI, and LLMs like GPT, Mistral, and LLaMA are transforming dashboards from static reports into intelligent agents. Familiar reporting tools turned into generative BI systems, predictive intelligence dashboards, and autonomous analytics capable of finding insights, predicting outcomes, and recommending decisions.

Data moves faster than traditional BI can handle
According to IDC, global data creation will reach 175 zettabytes by the end of 2025, a nearly fivefold increase from 2018. At the same time:
- 95% of businesses identify the need to manage unstructured data as a critical challenge.
- Enterprises use an average of 364 different SaaS applications across departments.
- Only 26% of businesses report strong BI adoption, despite BI tools being widespread.
Such mismatch, high data volume and low BI adoption underscores a structural gap. BI tools are more powerful, but also harder for decision‑makers to use. This is the gap AI data dashboards development, Copilot-style BI assistants, and generative BI systems close.

AI adoption overview
Over the last few years companies adopt AI with accelerating speed and up to unprecedented levels:
- 78% of enterprises report using AI in at least one business function, rising sharply from 55% in 2024.
- Generative AI adoption doubled within a year, with 65% of companies piloting or deploying LLM‑based tools.
- The global BI software market is projected to reach $47.48 billion by the end of 2025 and surpass $151.26 billion by 2034.
- Cloud-based BI usage has surged to 75% of enterprises.
Microsoft reports that Power Platform usage has reached 56 million monthly active users, and Power BI is now one of the most widely adopted cloud analytics tools in the world.
Together, these trends mean that AI is becoming the operating system for enterprise decision‑making.

Why traditional dashboards no longer meet the expectations
Traditional dashboards seem like they’ve done the job: track metrics, highlight trends, and offer a snapshot of business performance. But they reflect historical data, and retrospective orientation means that, by the time a dashboard shows that something went wrong, the impact has already taken effect.
Dashboards built on conventional Power BI customization still require users to search for meaning. They tell what happened, or where a number changed, or which department owns a particular issue. But they don’t predict what’s likely to happen next or explain why a metric is behaving that way, or what could happen with a different course of action. And they have no means to simulate the downstream impact of an event.
That’s where AI-powered business intelligence solutions come in, designed to observe, to interpret, predict, and advise.
Power BI enhanced with AI
Microsoft’s Power BI is one of the most powerful BI platforms in the world. But on its own, it was never designed to make predictions, simulate scenarios, or carry on a conversation with a manager trying to understand the landscape and make data-driven decisions. That’s why Microsoft expanded the Power Platform to support advanced AI integration at every layer.
By embedding capabilities like the Azure OpenAI Service, GPT and LLaMA-based Copilot extensions, and PyTorch-powered predictive models via Azure Machine Learning, businesses can create custom AI dashboards that go beyond drag-and-drop visuals. These new systems offer:
- Autonomous insight generation that surfaces patterns and anomalies without manual filtering
- Real-time anomaly detection across large, multi-dimensional datasets
- Natural language querying via text or voice, allowing non-technical leaders to ask complex questions conversationally
- Predictive and prescriptive modeling that supports forecasting and scenario planning
- Multi-source data fusion from platforms like Salesforce, Oracle, Dataverse, and Microsoft Fabric
- AI-driven recommendations, helping to move from observation to execution in minutes.
When these elements come together, it results in an AI-augmented decision orchestration system, capable of continuously adapting to new data, new constraints, and evolving market dynamics.
From dashboards to intelligence
A recent MIT Sloan study found that 87% of executives think their businesses need predictive and prescriptive analytics to remain competitive, yet fewer than one-third have the tools for that. According to Accenture, 61% of business leaders say they struggle to act quickly because insights arrive too late, or lack the depth to justify action.
- In fact, 70% of global DX roadmaps now list AI-driven BI modernization as a top-three priority, according to KPMG’s survey.
- This is why services like enterprise BI modernization, Power BI AI integration, and custom AI dashboards for enterprises have moved from beneficial to essential.
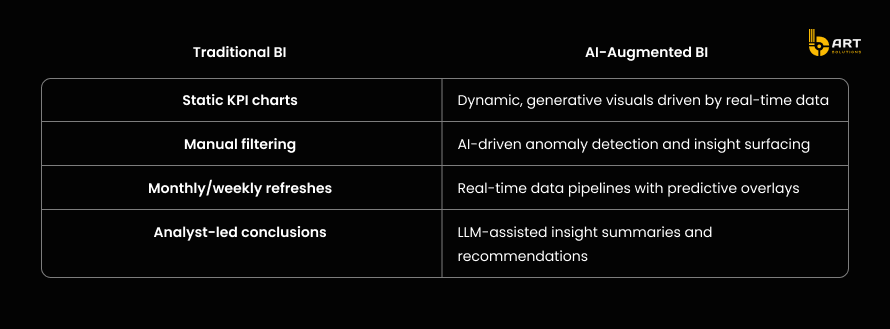
The shift in practice
Here’s how the shift plays out:

Where BART Solutions fits
At BART Solutions, we build custom AI and BI solutions that bring intelligence to the core of business analytics.
We deliver solutions that combine:
- Power BI and Power Apps for front-end visualization and automation
- Azure AI and OpenAI APIs for generative dashboards and natural language querying
- PyTorch and Azure ML pipelines for predictive simulations
- Microsoft Fabric, Databricks, and Snowflake Cortex for high-performance data processing and semantic layer integration
- Deep cross-platform expertise to unify Dynamics 365, Salesforce, custom ERPs, and external APIs into one cohesive ecosystem
Our clients turn to us for:
- AI dashboard development tailored to their workflows
- predictive analytics dashboards using PyTorch
- LLM-powered BI assistants embedded in their portals
- real-time AI dashboards that support logistics, finance, healthcare, and more
- voice-based BI querying to enable C-level decision-making without spreadsheets and slides
- We turn raw data into insights which become action and shape strategy.
Let’s talk about what your business demands.
Contextual and conversational BI
Generative BI systems built on large language models (LLMs) and intelligent AI agents are redefining what business intelligence means.
By embedding LLMs such as GPT‑4, LLaMA 2, or Mistral into Power BI or custom AI dashboards for enterprises,companies build conversational BI tools that really understand business intent. This unlocks natural, dialogue-driven analytics and makes data access universal.
Why LLMs are great for business intelligence
Traditional Power BI customization works best when the questions are narrow, predefined, and based on structured data. But there are other layered questions like:
“Which regions underperformed after the last campaign?”
“What if Supplier A delays shipments by 10 days?”
“Where are we bleeding costs in last-mile logistics?”
These queries cover multiple datasets, require reasoning, and mix structured metrics with unstructured context. That’s where LLM-powered BI assistants shine.
LLMs are great at:
- Natural language understanding, letting users ask questions in plain English.
- Contextual reasoning, interpreting data across dimensions like time, geography, and process.
- Semantic translation, bridging human language and complex back-end systems like Microsoft Fabric, Dataverse, or Snowflake.
In short, LLMs make BI more accessible, more strategic, and more aligned with how executives think.
What LLMs in BI looks like
At the technical level, tools like the Model Context Protocol (MCP) allow BI platforms to expose datasets securely to LLM agents. These agents can query live data, generate summaries, perform root-cause analysis, and return actionable output directly within a dashboard.
A user types: “Compare Q2 vs Q3 gross margin across product lines. Highlight where cost of sales increased and suggest likely causes based on shipping logs.”
The LLM interprets the intent, retrieves the correct data, executes logic, and presents not only the numbers but the causes behind them.
In a custom BI environment, these assistants pull from multiple systems (ERP, CRM, IoT, shipping logs, etc.), merging real-time analytics with contextual awareness.
When connected to Power Platform, they automate follow-up actions like triggering a workflow in Power Automate, updating a record in Dataverse, or suggesting form adjustments in Power Apps. This creates a closed loop between insight and execution.
Business value of generative dashboards
- The shift to LLM-driven business intelligence creates measurable value:
- 10× faster time-to-insight: LLMs remove the friction between a question and the answer. What once required a BI developer now happens in real time.
- Democratization of data: Any team member, regardless of technical background, can interact with enterprise data through voice-based BI querying or chat interfaces.
- Increased decision quality: LLMs provide consistent, semantically correct summaries, reducing misinterpretation.
- Scalability across business units: From finance to logistics to HR, LLM-powered dashboards adapt to context without needing new builds for each use case.
This is why more enterprises are turning to AI dashboard development, Power BI Copilot integration, and outsourced AI integration services to future-proof their analytics stack and turn insight into impact fast.

Predictive and prescriptive dashboards
In a highly competitive environment companies need forecasts, risk alerts, and actionable suggestions. That’s exactly where predictive analytics dashboards, powered by machine learning frameworks like PyTorch and deployed via cloud infrastructure such as Azure ML, come into place turning custom BI software development into strategic advantage.
Trends and statistical proof
- According to a 2025 industry review, companies using AI-driven predictive analytics see significantly improved demand forecasting accuracy, optimized inventory management, and reduced supply‑chain risk.
- A recent study found AI supply‑chain visibility systems can lead to a 20–30% reduction in inventory costs, a 30–50% decrease in stockouts, and up to a 65% improvement in forecast accuracy.
- In practical deployments, AI‑powered inventory forecasting (especially in retail and manufacturing) has resulted in ~15% fewer stockouts and ~20% reduction in excess inventory carrying costs.
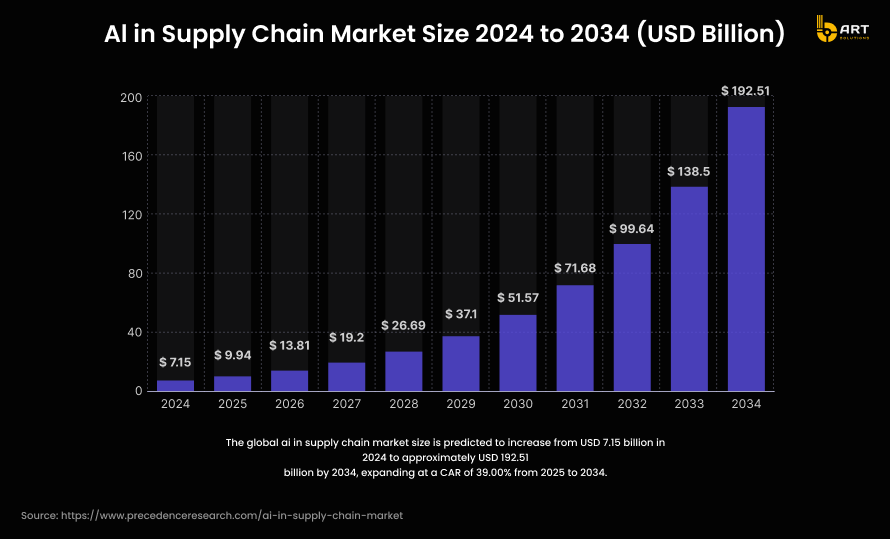
- According to recent market research, the global AI in supply chain market, which underpins a large share of predictive‑BI demand, is projected to grow from about USD 9.94 billion in 2025 to nearly USD 192.5 billion by 2034, at a CAGR of ~39%.
Hard numbers show why companies across manufacturing, logistics, retail, and distribution increasingly treat predictive intelligence dashboards and AI-powered business intelligence solutions as strategic assets.
Enterprise‑ready predictive dashboards
Here’s why combining a flexible ML framework (like PyTorch) with a scalable cloud ML platform (Azure ML), and embedding results into a custom AI dashboard, makes sense:
- Flexibility for complex modeling: PyTorch supports neural networks, time‑series forecasting, anomaly detection, which is essential for modeling demand fluctuations, supplier delays, production cycles, or equipment failures.
- Scalability and maintainability: Azure ML enables model versioning, automated retraining, scaling, and deployment pipelines, required for businesses with large datasets and frequent updates.
- Integration with existing enterprise data stacks: By connecting to data warehouses, ERP and CRM systems, real‑time IoT feeds, and BI tools like Power BI or custom dashboards, the predictive models’ outputs become immediately actionable.
- Support for scenario modeling and “what-if” simulations: The combination lets decision-makers run hypothetical scenarios and see projected impacts on inventory, delivery times, costs, and risk.
This architecture turns raw data into dynamic business foresight, which usual dashboards can never deliver.
Real-world impact
Adopting predictive‑BI systems brings measurable improvements across supply chain, manufacturing, and operations:
- Reduced supply‑chain disruptions and improved resilience: With AI‑driven forecasting and risk detection, companies can predict and mitigate supplier delays, logistic bottlenecks, or demand spikes long before they impact production or delivery.
- Lower inventory costs and improved turnover: By forecasting demand more accurately and aligning procurement and production, companies reduce excess inventory and carrying costs, while minimizing stockouts.
- Better decision‑making speed and agility: Scenario simulations and prescriptive outputs mean executives can evaluate multiple strategies rapidly (e.g. “if demand spikes 25% next quarter, can we fulfill it without stockouts?”, “what is cost impact if we shift to alternate supplier?”) and act proactively.
- Cross‑functional optimization beyond production: Predictive dashboards support procurement, logistics, demand planning, inventory, maintenance, helping to align supply‑chain, production, finance, and sales.

Multi-source data fusion & semantic layers
Data is everywhere and nowhere unified. Sales metrics are in Salesforce, customer interactions in Dynamics 365, financial systems on Oracle, product data in Snowflake, and machine logs stream into Databricks. Each department operates in its own silo, with its own definitions, schemas, and reporting logic.
It leads to fragmented dashboards, conflicting KPIs, slow decisions, and costly mistakes.
To unlock true intelligence, companies go beyond integration, they utilize semantic consistency, powered by AI.
Disparate data and inconsistent meaning are solveable
According to Forrester, the average enterprise pulls data from over 400 distinct sources. IDC estimates that 60–73% of all enterprise data goes unused for analytics, not because it isn’t valuable, but because it’s too hard to unify or interpret.
Even when companies use advanced tools like Power BI, most dashboards are limited to pre-modeled datasets. They struggle to merge sources with different structures, business rules, or taxonomies.
For example:
- “Customer” in Oracle may mean billing entity
- “Customer” in Salesforce may mean opportunity lead
- “Customer” in Dynamics 365 may mean account contact
Without a semantic layer, those systems can’t speak the same language.
This is where AI-powered schema mapping and semantic AI layers step in, forming the core of multi-source data fusion in analytics.
What is a semantic layer
A semantic layer is a business-friendly abstraction of complex data infrastructure. Instead of asking BI users to remember table names, joins, or DAX expressions, it exposes consistent business concepts like “Revenue”, “Customer Lifetime Value”, or “Return Rate”, regardless of where or how that data is stored.
Manually building and maintaining a semantic layer across hundreds of systems is error-prone and slow, AI becomes a force multiplier.
AI-powered semantic modeling includes:
- Automated schema mapping: using LLMs and embedding models to align tables, fields, and metrics from systems like Salesforce, Oracle, Microsoft Fabric, or Dataverse, even when naming and structure differ.
- Ontology generation: dynamically inferring relationships and hierarchies between business entities across domains.
- Natural language metadata enrichment: allowing non-technical users to query using plain English while the system maps intent to precise logic.
- Real-time semantic federation: stitching together live data from multiple platforms without moving it into a central warehouse.
Combined this turns into AI-powered business intelligence solutions that are faster to build, easier to scale, and far more usable for business goals.
Why this matters
Companies that implement semantic AI layers and multi-source analytics integration report major gains in operational alignment and decision speed.
According to McKinsey:
- Organizations with a unified semantic data model see 30–40% faster reporting cycles, since departments no longer reconcile data manually.
- Business users are 80% more likely to trust insights from dashboards built on semantic definitions, versus raw, ad-hoc data.
- Companies with semantic data layers are 3.5x more likely to successfully scale their analytics across business units and geographies.
In short: the semantic layer is actually a trust layer.

Humanizing BI with natural language interfaces
Even the most advanced AI-powered dashboards lose their value if people can’t use them easily. Too many systems still rely on filters, formulas, and data hierarchies that are unintuitive for most users.
By embedding natural language interfaces (NLIs) powered by LLMs into dashboards, companies can make BI truly accessible. These interfaces turn complex data queries into human dialogue, enabling any stakeholder to ask a question and get a trustworthy, structured response.
BI tools are still too technical
Despite massive investments in BI platforms, most users still struggle to access insights independently:
- A survey by Dresner Advisory found that 62% of business users rely on data analysts or IT to build or interpret dashboards.
- Gartner reports that only 26% of employees in data-driven organizations use BI tools regularly.
- 93% of executives say faster access to insights would significantly improve their ability to act on business opportunities.
Traditional BI tools speak in metrics, filters, and DAX expressions. Executives and frontline managers speak in outcomes, scenarios, and plain questions.
Using voice-based BI querying, chat-driven analytics, and LLM-powered BI assistants, businesses can democratize access to data and drastically reduce their dependency on BI specialists.
How natural language interfaces work inside BI systems
Modern natural language BI systems typically integrate a few key layers:
- LLM engine: Tools like GPT, LLaMA, or Mistral are trained or fine-tuned on enterprise-specific schema and documentation to understand company context.
- Semantic layer integration: The LLM maps user intent to clean business definitions and consistent logic (e.g., “top revenue by product in Q2” routes to a validated data model).
- BI connector: Via Power BI AI integration services, APIs, or MCP servers, the assistant queries live data and returns formatted visualizations or text-based summaries.
- Response engine: Answers come in human-friendly form (e.g., “Revenue in Q2 was 14% lower than Q1, mainly due to a decline in the B2B segment across two regions.”)
This system dashboards into generative BI systems capable of back-and-forth dialogue, smart follow-ups, and real-time insight delivery.
Strategic benefit
Natural language BI isn’t just a UX improvement it changes the business process.
- Executives get answers in seconds, not hours or days, enabling faster strategy shifts.
- Frontline teams gain autonomy, bypassing analyst queues to get immediate context.
- Data literacy rises across departments, because anyone can explore insights without needing a SQL or Power BI background.
- Insights become conversations better aligned to how humans actually make decisions.
Companies implementing LLM-driven business intelligence report:
- Up to 60% reduction in report request volume to data teams
- 70% increase in BI engagement across non-technical departments
- 3–5× faster time-to-insight for common strategic questions

Responsible AI in business intelligence
As AI becomes central to analytics workflows, companies face a new challenge: ensuring that AI-powered business intelligence solutions are ethical, secure, transparent, and compliant. The stakes are high: in finance, healthcare, and government sectors, misused or poorly governed AI can lead to regulatory fines, reputational damage, biased decisions, or even harm to human lives.
Despite widespread adoption, most enterprises are still underprepared. According to a Gartner survey, only 38% of organizations using AI in analytics have a formal AI governance framework, and less than 24% perform regular audits on their AI outputs.
The acceleration of LLM-powered BI assistants, predictive dashboards, and AI dashboard development has outpaced many companies’ ability to govern them. Without strong guardrails, these systems can mislead decision-makers, expose sensitive data, or quietly reinforce systemic bias.
Risks of AI-driven BI
When AI becomes the front-end of business decisions, via voice-based BI querying, Copilot-style assistants, or generative BI systems, even small errors in logic, data, or training assumptions can scale fast.
Key risks are:
Model bias and discrimination: Without oversight, AI systems may replicate or amplify bias across race, gender, geography, or socioeconomic factors. An IEEE report found that 78% of AI models trained on unbalanced enterprise data introduced at least one measurable bias into decision outputs.
- Opacity and explainability gaps: Many predictive analytics dashboards using PyTorch or deep learning models operate as black boxes. This makes it difficult for stakeholders to trust, interpret, or challenge outputs, especially under audit conditions.
- Regulatory compliance: With new AI regulations emerging (e.g., EU AI Act, U.S. Algorithmic Accountability Act), companies must prove that their models are explainable, unbiased, and compliant. Failing this can result in fines up to 6% of global revenue in the EU.
- Security vulnerabilities: Integrating AI models into Power BI, Dataverse, or Microsoft Fabric without proper access controls can expose sensitive data or lead to prompt injection attacks in LLMs.
In short, AI integration into Power BI and Dynamics 365 requires more than software development, it demands responsible architecture, oversight, and transparency.
Cornerstones of responsible AI in business intelligence
A robust framework for responsible AI in BI includes:
1. Explainability and interpretability
- Use explainable models where possible (e.g. tree-based, regression, SHAP-explained neural networks)
- Provide reasoning paths for each insight: “This forecast is based on variables A, B, C, with 82% confidence.”
- Implement lineage tracking so stakeholders can trace each dashboard metric to data source and model logic
2. Bias detection and mitigation
- Run audits on AI models for disparate impact across protected groups
- Integrate fairness metrics (e.g., demographic parity, equalized odds) in AI workflow management
- Use synthetic datasets to test for biased outputs before deployment
3. Access control and secure AI deployment
- Use Power BI AI integration services and Dataverse with role-based security
- Prevent LLMs from leaking private data during summarization
- Deploy AI behind secure, audited API layers especially when using OpenAI, Azure AI, or third-party LLMs
4. Compliance readiness
- Maintain full audit logs for AI decisions, forecasts, and recommendations
- Ensure compatibility with regulations like GDPR, HIPAA, the EU AI Act, and financial data standards (e.g. SOX)
- Document model assumptions, limitations, and retraining policies
The strategic value of responsible AI
Responsible AI unlocks long-term value:
- Accelerated AI adoption: When systems are transparent, business leaders trust and use them more
- Cross-functional alignment: Legal, compliance, and tech teams speak a shared language around risk
- Future-proofing: Regulations are tightening. Companies with mature governance now will avoid retroactive fixes later
- Brand value: As AI becomes public-facing (e.g. LLM-driven business intelligence, automated reports), trustworthy outputs protect reputation.
At bART Solutions, we help companies embed responsibility directly into the systems we build, delivering real-time AI dashboards, LLM-powered BI assistants, or advanced AI integration outsourcing projects.
The future of AI-enhanced BI development
As AI continues to evolve, the next generation of AI-powered business intelligence solutions will go beyond reporting the past or forecast the future. They’ll begin to shape it autonomously, contextually, and continuously.
From reactive BI to self-optimizing intelligence
Today, most BI dashboards are still reactive: they surface insights, but it’s up to the user to interpret and act.
The emerging wave of LLM-powered BI assistants, real-time AI dashboards, and custom AI dashboards for enterprises can automate analysis and proactive intervention.
The evolution looks like this:
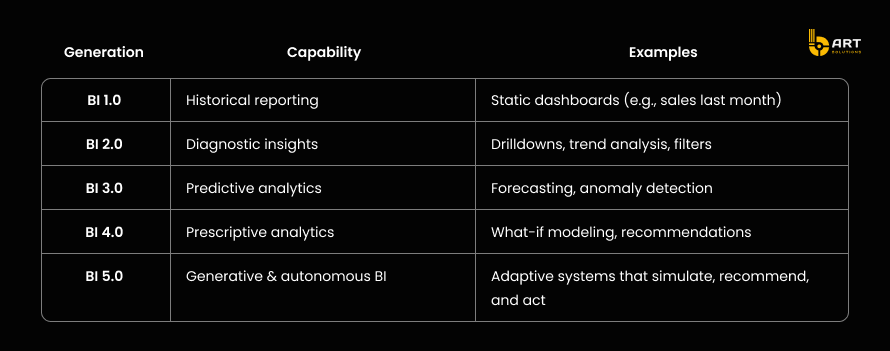
By 2027, Gartner predicts that 60% of BI queries will be generated via natural language, and that AI-driven dashboards will become the default interface for most enterprise analytics. Forrester adds that by 2026, at least 25% of AI-generated insights will be consumed and executed without human review.
Building autonomous BI systems
To build this kind of AI-augmented BI, business should combine:
- Predictive modeling with tools like PyTorch and Azure Machine Learning, to forecast events before they happen
- Prescriptive engines that simulate actions and recommend optimal paths (e.g. inventory strategy, campaign timing, resource allocation)
- Generative dashboards using LLMs like GPT, LLaMA, or Mistral, for interactive insight delivery, summarization, and contextual reasoning
- Semantic layers that unify metrics across systems like Dynamics 365, Snowflake, Oracle, and Salesforce
- Workflow integration via tools like Power Automate, so insights flow directly into business actions
With these in place, BI system becomes a closed feedback loop, continuously learning, adapting, and refining itself.
BART Solutions perspective
We design AI-powered reporting dashboards as part of broader decision frameworks. These systems learn from user behavior, optimize reporting logic, and adapt outputs over time.
For example, a supply chain analytics platform we built:
- Predicts inventory shortfalls with PyTorch
- Simulates restocking plans using a prescriptive ML layer
- Uses a Copilot-style BI assistant to explain risks to operations managers
- Automatically triggers procurement workflows if forecast confidence passes 90%
- Logs actions and outcomes for continuous retraining
Preparing for the future
Companies who want to succeed this new era need to shift mindset:
- From building dashboards → to designing decision frameworks
- From historical KPIs → to forward-looking, adaptive metrics
- From data teams as service providers → to AI as embedded strategy infrastructure
- From scattered systems → to unified, semantic, real-time ecosystems
This requires investment in AI infrastructure for Python apps, semantic integration, AI model lifecycle management, and above all, BI modernization. But the payoff is huge: faster decisions, leaner operations, more resilient planning, and the ability to act on data before your competitors even recognize the opportunity.
Final thoughts
Business intelligence was once about answering questions. Now it’s about anticipating them, and answering before they occur.
By blending predictive analytics, generative AI, and workflow automation, the future of BI is about a decision layer woven directly into business operations.
At BART Solutions, we are helping to build the trend. As a Microsoft certified AI BI development partner, we assist businesses:
- Design enterprise analytics integration services that unify data and insights
- Implement LLM-driven business intelligence that speaks human language
- Deliver custom AI and BI solutions provider services tailored to each domain
- Scale AI application development with best-in-class cloud infrastructure
- Govern AI integration with compliance-ready architecture for real-world deployment
Let’s create the future of business intelligence together, contact us to start building.